
"Do what you say, say what you do.” – a common one-sentence formulation of ISO-9000.
In this post, we’ll explore the what, why and how for a metric of innovation effectiveness: the do-say ratio.
What is the do-say ratio?
The do-say ratio is a backward-looking, future-influencing metric. It is backward-looking because it relies on historical data from completed projects. It is future-influencing in that it dramatically portrays gaps between aspiration and accomplishment, thereby providing incentive for improvement.
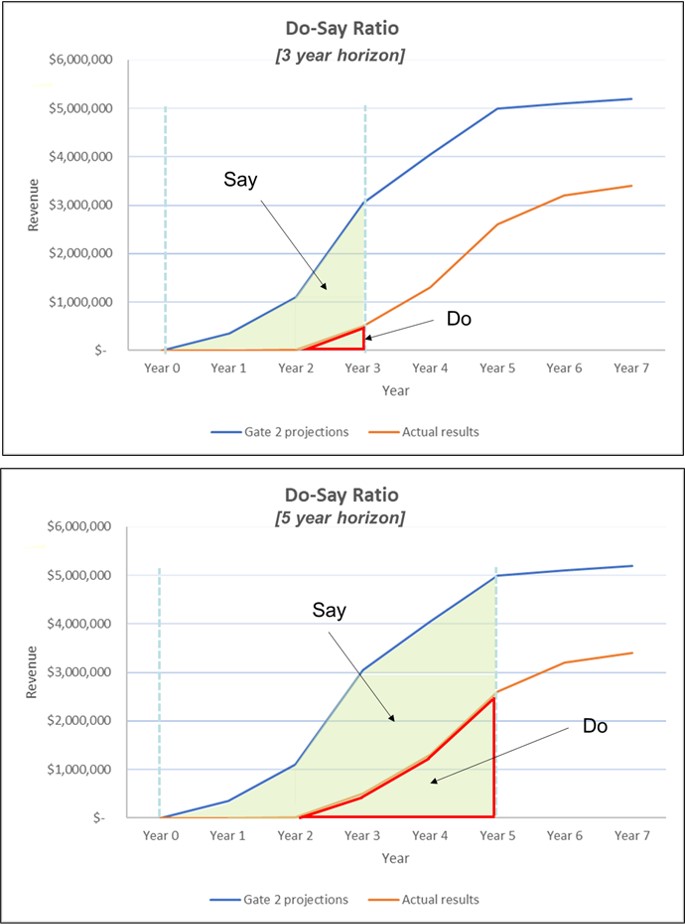
The denominator (“say”) reflects the payoff that was expected at the time of approval and that justified resource investment. The numerator (“do”) reflects actual delivery of project results.
My experience is in applying this to innovation projects; it could, however, be applied to many other types of projects and portfolios.
The calculation methodology is given later in this post.
Why use the metric?
Deployed properly, the metric can encourage behavior leading to improvements in both the up-front homework used to justify resource investment and in project execution. It can lead to improvements in accountability, data collection, and project portfolio governance.
The metric considers only past data. A key benefit is therefore in eliciting questions for post-project audits. The ratio is most instructive when it is used to compare multiple projects in a portfolio. Analyses of do-say differences among projects can lead to organizational learning and improvements for future project selection and execution.
Two potential pitfalls
Not all projects are created equal
Incremental, lower risk projects will likely have better do-say ratios than shoot-for-the-moon projects. Expect to have poorer do-say ratio, including more variation, for the latter.
Be careful what you measure
The metric can be used as a tool for punishment (as is the case for many metrics, in fact). It should not be used to assign blame, but rather to identify opportunities to improve.
A case study
I was involved in a project to help a business unit understand the factors leading to innovation project success. As part of our assessment, we decided to determine the do-say ratio for a number of past projects in the portfolio of innovation projects. The business defined a new product as one that had been on the market for 5 years or less. Leadership was interested in the ratio for both a 3 year and 5 year horizon, so the analysis was performed for both.
Data for the denominator (“say”) were mined from minutes of project gate reviews and other meeting documentation. Data for the numerator (“do”) were mined from company financial records.
Some of the key findings that led to positive discussions and improvements included:
- almost invariably, timing of actual sales were later than predicted and peak income was lower than projected
- start date for income projections were sometimes ambiguous or inconsistent in the historical documentation
- the graphical representation of the metric was much more powerful in demonstrating need for improvement than simply presentation of numbers
An example of a typical pair of graphs (3 and 5 year results) are shown here.
After compiling data and creating graphs for various projects, we interviewed project team members to understand causes for the do-say discrepancies. We found that these graphs were profoundly helpful in provoking thoughtful discussions. Although most folks had a sense that projects were not delivering as hoped, these graphs provided a simple yet dramatic, quantitative visualization. In the interviews, a recurring theme was that customer CTQs (critical to quality deliverables) were typically not well understood/defined at the outset, or that the CTQs shifted over time. Shifts occurred because the world had evolved due to better understanding of the problem or that solutions by competition have solved the problem. It underscored the importance of avoiding VOO (voice of ourselves) during the voice of the market / customer activities, and of keeping customers engaged throughout development.
How to calculate and graphically depict the do-say ratio
- Achieve consensus on the
- portfolio boundaries (e.g., separate moon-shot projects from incremental product tweak projects)
- point in the business process where the “say” snapshot is fixed; for an innovation project, a logical choice would be the “proceed to development” gate, sometimes known as the “money gate.” In this case, projects killed at that gate would be excluded from the portfolio
- time horizon (e.g., a product with a short life cycle such as a consumer electronic would likely have a shorter time horizon than for a durable goods product)
- metric of measurement (e.g., revenue, margin, volume)
- Collect the data for projects in the portfolio
- Plot the data for each project
- Determine the area under each of the two curves for each project
- Calculate the ratio for each project
For an aggregate portfolio metric,
- choose a time frame of interest
- divide the sum of all the “do” values by the sum of all the “say” values.
Summing up
The do-say ratio is a graphical and numerical representation of the comparison of what a project was expected to achieve and what actually happened. It should be used as a tool for organizational learning. It should not be used as a tool for finding blame. Many factors can contribute to good or bad results; the metric should be used to prompt conversations regarding identification of those factors leading to improved results.